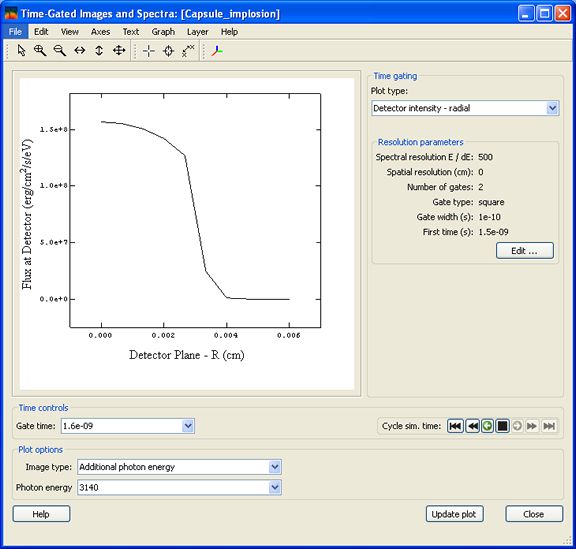

If the detector is a disk, the time-gated radial intensity can be shown by selecting Detector intensity - radial in the Plot type combo box.
To enter the time gate parameters, click on the Edit... button in the Resolution parameters frame. See Spectral and Image Resolution. A spatial resolution may also be set.
Other images types may be selected from the Plot options combo box. The list of available images will depend on what was specified in the workspace for the simulation. If more than one image is available for a particular image type, they will be listed in the combo box beneath the image type combo box, e.g. for the Additional photon energy images, the photon energies used will be listed. Clicking on the Update plot button will display the image at the first gate time.
Images at other gate times are displayed by:
Functionality from left to right:
For information on how to modify the plot parameters or save images from the graph, see the PrismPLOT Users Guide.
| Copyright © 2024 Prism Computational Sciences, Inc. | VISUALIZER 20.5.0 |